
Key Highlights
- BNB enters August 2026 at a crucial technical level, with analysts watching for either a breakout above resistance or a correction below key support.
- Ecosystem growth, quarterly token burns, and BNB Chain upgrades could support bullish momentum, while regulatory risks and weak ETF inflows remain headwinds.
- Historical August performance is mixed, making market sentiment and broader crypto trends critical for BNB’s next move.
As August 2026 is approaching, all eyes are on BNB, the utility token powering the expansive BNB Chain ecosystem. Currently trading around the mid-$570s, BNB finds itself at a critical technical juncture. The coming weeks could determine whether the token breaks out to fresh highs or succumbs to selling pressure and enters a deeper correction.
With a market capitalization exceeding $76 billion, BNB remains one of the most established cryptocurrencies, backed by the world’s largest exchange and a blockchain ecosystem. Its performance is influenced by multiple factors: quarterly token burn mechanisms, growing adoption of BNB Chain in DeFi and gaming, Binance’s global regulatory developments, and the broader crypto market sentiment.
This BNB price prediction for August 2026 examines the key drivers, critical resistance and support levels, and plausible scenarios that could unfold. Will renewed ecosystem growth fuel a strong rally, or will market headwinds trigger a breakdown? The coming month promises to be pivotal for one of crypto’s heavyweight assets.
What does the current price for BNB reveal
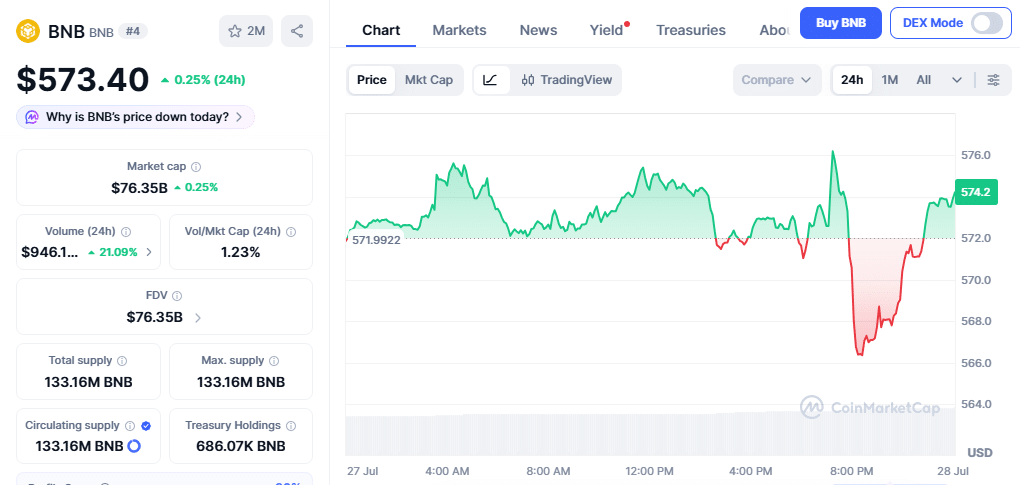
BNB is currently trading at $573.40, marking a modest 0.25% gain over the past 24 hours. With a substantial market capitalization of $76.35 billion, BNB continues to rank among the top cryptocurrencies by market value, reflecting its enduring utility and strong ecosystem backing.
The token has shown resilience amid recent market fluctuations, experiencing a notable dip followed by a swift recovery, as visible on the 24-hour chart.
With total and circulating supply both standing at approximately 133.16 million BNB, the token’s scarcity dynamics and treasury holdings of over 686,000 BNB add another layer to its valuation narrative.
The all-time high noted on October 13, 2025, sat at $1,370.55, and currently the token is 58.33% lower than that time.
What does the historical data for August reveal?
BNB’s historical performance during August shows a mixed but slightly bearish tendency over the past nine years. While the token has delivered strong gains in certain years, August has more frequently ended with losses or modest growth.
| Year | August 1 Open | August 31 Open | % Change |
| 2017 | $0.1046 | $2.3282 | +2,126% |
| 2018 | $13.77 | $10.76 | -21.9% |
| 2019 | $27.62 | $22.21 | -19.6% |
| 2020 | $20.67 | $23.65 | +14.4% |
| 2021 | $332.29 | $460.62 | +38.6% |
| 2022 | $283.63 | $281.46 | -0.8% |
| 2023 | $241.13 | $223.82 | -7.2% |
| 2024 | $576.37 | $535.32 | -7.1% |
| 2025 | $783.66 | $862.40 | +10.0% |
Since the token’s launch in July 2017, out of nine years, only four saw positive returns in August, while five closed lower. The massive 2017 gain occurred during BNB’s explosive early phase. In recent years (2022–2024), August has been consistently weak or flat, with 2025 breaking the negative streak with a solid 10% gain.
Historically, August has not been BNB’s strongest month, especially in mature market cycles. With the token trading near all-time high levels in 2025, profit-taking pressure could lead to sideways or mildly negative performance similar to 2022–2024.
However, strong ecosystem growth or a bullish broader market may support gains like 2025. Traders should prepare for potential volatility and monitor key support levels.
Will BNB witness a breakout ahead?
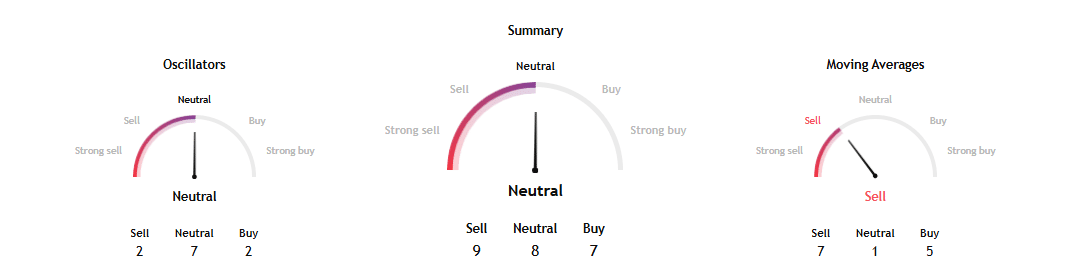
Technical indicators present a mixed picture that supports a bearish breakout. While oscillators remain largely neutral, longer-term moving averages are signaling “Sell,” suggesting negative momentum. The current price action near $573 shows consolidation after a recent dip and recovery.
On the Fibonacci scale, significant resistance lies at $1,326 (R1) and $1,788 (R2). A decisive move above the pivot point of $913.14 would be the first major confirmation of bullish momentum. Clearing these Fibonacci levels could open the path toward $2,000–$2,500 in the medium term.
However, the current momentum reveals that reaching the target price is not impossible, but yet an aggressive target.
BNB Chain’s aggressive H2 2026 roadmap, targeting over 10,000 TPS, next-gen L1 architecture, and AI agent infrastructure, could drive strong ecosystem growth. Continued quarterly token burns, rising DeFi and RWA activity, and positive broader market sentiment may fuel buying pressure.
Will BNB witness a breakdown ahead?
Conversely, several warning signs point to possible downside risk. The summary gauges lean toward “Sell” on moving averages, with short-term EMAs and SMAs flashing sell signals. Momentum and MACD also indicate weakening bullish strength, while the overall technical setup remains neutral-to-bearish in the near term.
From the Fibonacci perspective, critical support levels sit at $451.16 (S1) and $38.03 (S2). A breakdown below the pivot point of $913.14, especially losing the $570–$580 zone, could accelerate selling toward much lower supports.
The downward momentum from the current price near $573 to the first support zone at $451.16 is not too far as compared to its upward momentum to reach the first resistance at $1,326. However, any catalyst can easily kill or change the momentum.
Increased competition from rival chains (including Robinhood Chain in RWAs), regulatory uncertainty surrounding Binance, profit-taking near current highs, and a risk-off macro environment could trigger selling. Failure to deliver on roadmap milestones may also disappoint investors.
What does the ETF market suggest for BNB?
The launch of VanEck BNB ETF (VBNB) in May 2026 marked a step forward for institutional exposure to BNB. However, its performance has been underwhelming so far. As of late July 2026, the ETF’s NAV stands at $21.94, reflecting a -12.26% decline since inception.
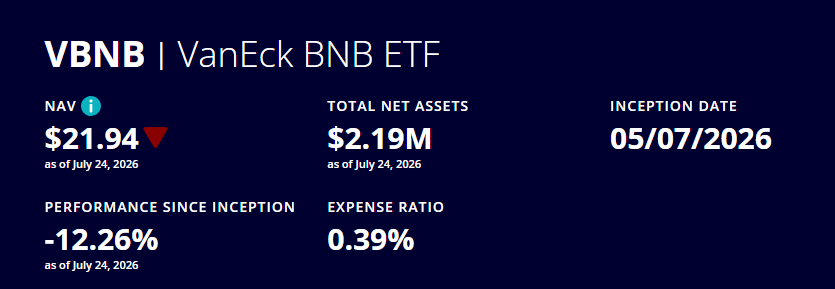
Month-to-date, it is down approximately -14.78%, while year-to-date it has lost -15.10%. The market price closely tracks the NAV at around -14.87% for the month. With only $2.19 million in total net assets and a reasonable 0.39% expense ratio, the fund remains small, indicating limited investor enthusiasm since its launch. It has also underperformed its benchmark index.
The weak ETF performance suggests cautious institutional interest and limited fresh capital inflow into BNB through this vehicle. Poor returns may discourage new investors and create mild selling pressure or reduced buying support in August. While the existence of a regulated BNB ETF is fundamentally positive for long-term legitimacy, its current underperformance could weigh on sentiment and limit upside momentum in the short term.
Overall, the ETF market currently signals neutral-to-bearish near-term implications for BNB, highlighting the need for stronger ecosystem catalysts to offset weak institutional flows in August 2026.
BNB price outlook for August 2026: Bull, Base, and Bear Cases
Bull Case:
If BNB breaks decisively above the $600–$650 zone. In this scenario, BNB could target $720–$850 by the end of August.
Base Case:
If BNB experiences range-bound trading between $520 and $620, reflecting mixed technical signals and cautious institutional flows via the VanEck ETF. This scenario aligns with historical August performance and assumes no major positive or negative catalysts emerge and traders can expect choppy consolidation with volatility around 8–12%.
Bear Case:
BNB loses critical zone $550–$570, triggered by weak ETF performance, profit taking, increased competition from rival chains, or a broader market correction. Failure to hold the zone could accelerate selling toward $450–$380. This would mirror the weaker August performances seen in 2018, 2019, and 2023–2024.
BNB August Outlook
BNB’s August outlook does not seem to be supportive, but also cannot call it a complete bearish outlook.
As the historical data has remained mixed for August, any positive updates can take the price upward; conversely, it can witness a correction. For now, BNB’s August price prediction is neutral; it can either go upwards or downwards as well.
However, crossing the $1,000 mark to sustain at the first resistance level still remains an aggressive target.
Also Read: MSTR Price Prediction: Will Strategy Stock Crash After Bitcoin Sale?