
Key Highlights
- XRP gained 28.5% in August, marking its strongest August performance in five years, before losing some of those gains in September.
- XRP is now testing the $1.43 area, with $1.4437-$1.4586 acting as the key resistance zone. A break above it could open the way toward $1.55 and potentially $1.70.
- XRP ETFs continue to see strong investor demand, recording $18.96 million in net inflows for the week ending Sept. 4 and extending their positive streak to eight consecutive weeks.
XRP is facing a key test around the $1.43 resistance level after a strong August rally, with the token now trying to hold its recent gains.
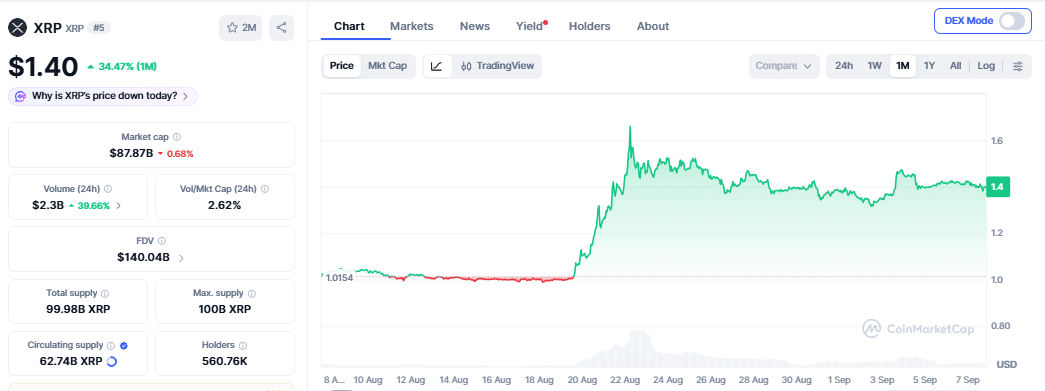
According to data from CoinMarketCap as of September 8 (7:21 PM UTC), the token has gained 28.5% in August, its best August performance in five years, but the price has since pulled back as buyers struggle to keep the rally moving.
At the time of reporting, XRP is trading around $1.43, with a market value of about $90.11 billion. The token has dropped 1.79% over the past 24 hours but remains up about 3.5% over the past week. It briefly moved above $1.42 during its recovery before falling back toward $1.396.
The $1.43 level becomes important
This $1.43 area has now become an important point for XRP. Immediate resistance sits at $1.4586- $1.4437, just a bit above its current price.
If buyers can keep XRP at this level or try to break above, the recovery could stay on track. A confirmed break below the $1.35-$1.36 support zone could open the way to further downside.
XRP looks for another recovery
The current weakness comes after a sharp recovery in August. XRP had fallen from its July 2025 high of about $3.65 to around $0.99 in mid-August, a decline of almost 73%. The decline was followed by a strong rebound that lifted XRP more than 60% in a few days and pushed it near $1.70.
The rally later ran into challenges. On Aug. 26, XRP suffered a flash crash due to the result of the PCE data. XRP then spent the first week of September moving between $1.30 and $1.50.
Buyers face resistance above $1.44
For the short-term recovery to push further, buyers need to push XRP back above $1.4586- $1.4437 resistance level. A move through that area could open the way toward the next high at $1.55 and then possibly $1.70. Until XRP breaks above the range, its recent rebounds could remain short-lived.

Meanwhile, the momentum is still there. The Relative Strength Index (RSI) on the daily is around 60, which suggests that buyers are controlling the market and still have room for more rally. On the weekly chart, RSI has fallen to around 53 after reaching overbought levels.
XRP ETFs keep attracting inflows
Still, XRP has some support outside the price chart. According to data from SosoValue, Spot XRP ETFs recorded $18.96 million in net inflows in the week ending Sept. 4, extending their positive streak to eight weeks.
The previous week saw $110.49 million in inflows, the biggest weekly amount of 2026. Total net inflows have now reached about $1.68 billion.
Also Read: Ethereum Price Prediction September 2026: Can ETH Reach $2,800?