

Key Highlights
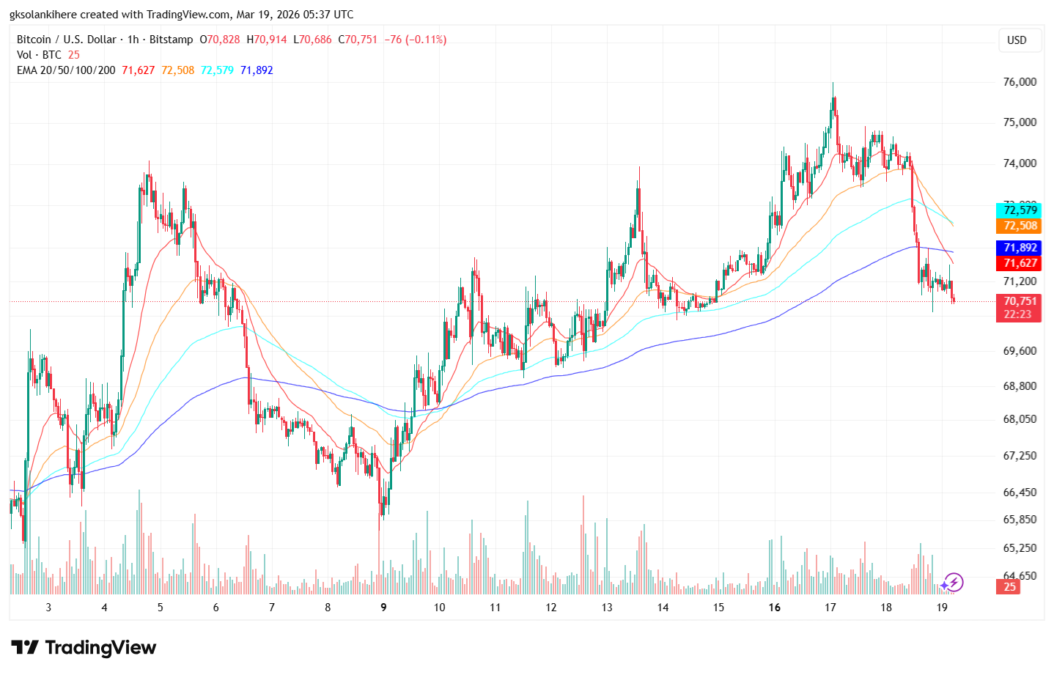
- Bitcoin fell ~4.5% in 24h to ~$70,750 (from near $71,600 high), extending pullback from >$74k. It’s consolidating between $65k–$75k post-2025 peak ($126k+), with high volume ($46B+) and classic post-halving correction underway.
- Large holders (10–10,000 BTC wallets) flipped to net buying ~two weeks ago, quietly absorbing dips. Miner selling eased and long-term holders stabilized, showing big-player strength despite retail fear (Fear & Greed ~33).
- Recent ETF inflows ($967M over seven days) turned mixed with March 18 outflows ($130M). Whale buying + fading selling pressure hint at underlying bullishness. Key levels: below $69k risks $60k–$65k; above $73k–$74k could spark upside.
Bitcoin price dipped sharply on March 19, 2026, sliding to around $70,800 after opening near $71,250 and briefly testing highs just under $71,600. The drop marked a roughly 4.53% decline over the past day, extending a pullback from recent levels above $74,000—as of latest market data.
The trading volume for the largest cryptocurrency remained elevated at over $46 billion in the last 24 hours, signaling active participation amid the volatility.
This short-term downward move comes after Bitcoin’s broader corrective phase following its October 2025 all-time peak above $126,000. The cryptocurrency has been consolidating in the $65,000-$75,000 range for weeks, with the market spectators noting a classic post-halving cycle correction that could stretch into mid-2026 before any sustained recovery.

At the time of publishing, Bitcoin (BTC) was trading near $70,751, with a 24 hour trading volume of $46.67 billion.
Whale accumulation signals underlying strength
At this time, on-chain data adds an intriguing layer to the price action. Large holders, often called whales, have resumed accumulation despite the pressure. Wallets holding between 10 and 10,000 BTC shifted from net selling to net buying starting roughly two weeks ago, according to Santiment metrics. This cohort, which controls a substantial portion of circulating supply (over 66% in some breakdowns), appears to be absorbing dips quietly.
Miners and long-term holders also show resilience. Miner capitulation eased significantly by early March, with net position changes for long-term holders improving dramatically (from heavy outflows to near-neutral).
Separate reports highlight significant whale inflows, including one anonymous entity purchasing over 2,626 BTC in recent periods, already netting paper profits in the millions during accumulation phases.
This whale behavior contrasts with retail sentiment, which remains cautious—Fear & Greed Index readings hovering still in fear territory around 33. Meanwhile, U.S. spot Bitcoin ETFs have shown mixed but recently positive flows. After a seven-day streak of inflows totaling nearly $967 million, the March 18 session saw outflows of $129.62 million—as per SoSoValue data.
Market observers view the combination of whale accumulation and fading extreme selling pressure as a potential bullish divergence amid the short-term bearish price trajectory. While macro factors like elevated oil prices and lingering geopolitical tensions continue to weigh on risk assets, Bitcoin’s on-chain signals suggest underlying strength building beneath the surface volatility.
Traders are watching closely: a break below $69,000 could test deeper supports near $60,000-$65,000, while a reclaim of $73,000-$74,000 might ignite renewed upside momentum. For now, the market remains in a delicate balance; price action weak, but conviction among big players quietly growing.
Also read: Bitcoin Rainbow Chart Flashes ‘Fire Sale’: Analysts Eye $150K–$440K Rally