

Key Highlights
- Ethereum begins August around $1,867, with technicals pointing to a cautious recovery but weak trading volume.
- Historical August performance is mixed, making macro conditions and key resistance levels crucial for ETH’s direction.
- ETF developments, interest rates, and Layer-2 growth could determine whether ETH rallies or extends its consolidation.
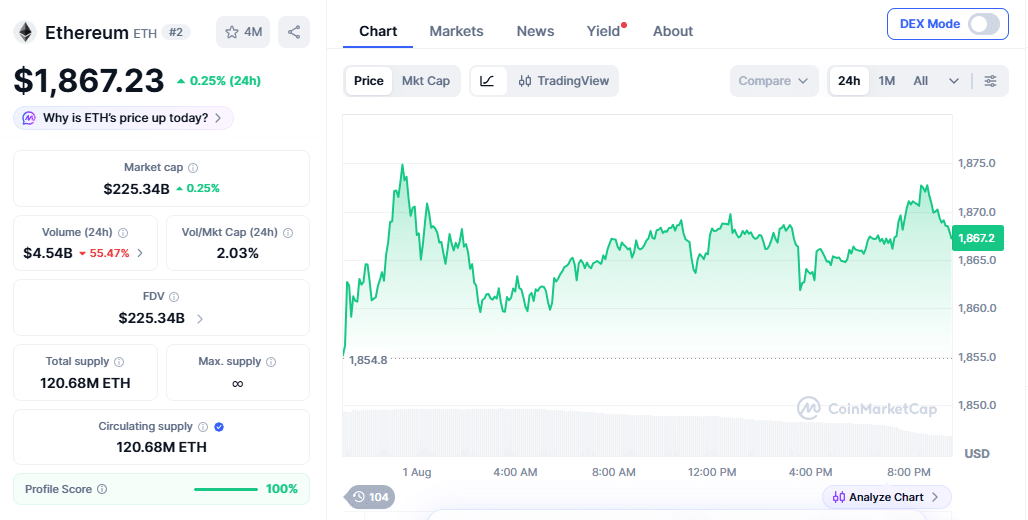
As August 2026 begins, Ethereum (ETH) is trading at $1,867.23, recording a modest 0.25% gain in the last 24 hours. With a market capitalization of $225.34 billion, the second-largest cryptocurrency continues to show resilience amid a volatile market environment.
The uptick comes as investors turn their attention toward the historically pivotal month of August, known for both sharp rallies and unexpected corrections in the crypto space. Ethereum finds itself at a crossroads.
After a strong run in previous months driven by network upgrades, Layer-2 scaling solutions, and growing institutional interest in tokenized assets, August presents both opportunities and challenges. Macroeconomic factors, including potential interest rate decisions, regulatory clarity around Ethereum ETFs, and the broader risk appetite in global markets, are expected to influence price action.
Will seasonal trends favor the bulls, or will external headwinds dominate? This price prediction explores the key factors, technical outlook, and potential scenarios that could shape ETH’s performance throughout August 2026.
What does the current price for ETH reveal
Ethereum is currently trading at $1,867.23, reflecting a modest 0.25% increase over the past 24 hours. With a market capitalization of $225.34 billion, the asset maintains its position as the second-largest cryptocurrency.
The 24-hour chart shows ETH making steady intraday gains, climbing from a low near $1,854.8 to a high of $1,876.09 before consolidating around $1,867. This price action reveals a market in cautious recovery mode.
While the daily performance is positive, the broader context is more complex. ETH remains approximately 62.28% below its all-time high of $4,953.73, recorded in August 2025. The relatively low 24-hour volume of $4.54 billion (down 55.47%) suggests limited aggressive buying interest, indicating that investors are still adopting a wait-and-see approach.
The current price reflects Ethereum’s struggle to regain momentum in a maturing market. Strong network fundamentals, including Layer-2 growth and institutional adoption, provide underlying support. However, macroeconomic uncertainty and competition from newer chains continue to weigh on sentiment. At $1,867, ETH appears fairly valued in the short term but lacks the conviction needed for a significant breakout.
August 2026 may prove decisive in determining whether this consolidation leads to a renewed rally or further correction.
What does the historical pattern reveal
Ethereum’s historical performance during August has been highly volatile, with no consistent seasonal bias across its trading history.
| Year | Aug 1 Open | Aug 31 Open | % Change |
|---|---|---|---|
| 2015 | $2.8316 | $1.3214 | -53.34% |
| 2016 | $11.89 | $11.24 | -5.47% |
| 2017 | $204.69 | $378.44 | +84.88% |
| 2018 | $433.87 | $284.12 | -34.52% |
| 2019 | $218.55 | $168.89 | -22.72% |
| 2020 | $345.80 | $428.51 | +23.92% |
| 2021 | $2,530.46 | $3,227.76 | +27.56% |
| 2022 | $1,681.45 | $1,524.29 | -9.35% |
| 2023 | $1,856.19 | $1,705.36 | -8.13% |
| 2024 | $3,231.25 | $2,525.86 | -21.83% |
| 2025 | $3,696.14 | $4,374.89 | +18.37% |
Out of 11 years, four Augusts closed higher and seven closed lower. The month delivered strong gains in 2017 (+84.88%), 2021 (+27.56%), 2020 (+23.92%), and 2025 (+18.37%), but also sharp drawdowns, most notably in 2018 (-34.52%), 2019 (-22.72%), and 2024 (-21.83%).
The pattern reflects no reliable seasonal edge. Performance appears more dependent on the broader market cycle than calendar trends. Bull market years (2017, 2020–2021, 2025) generally favored upside, while corrective phases led to losses.
For August 2026, with ETH near $1,867, well below 2025 highs, historical data suggests a neutral to mildly bullish outlook. If the market stays in a recovery phase similar to 2020 or 2025, ETH could plausibly post double-digit gains. However, the mixed record warns against over-optimism. Traders should monitor macroeconomic conditions and key resistance levels rather than relying solely on historical seasonality.
What does ETH ETF market suggest for August 2026 price

The spot Ethereum ETF landscape presents a mixed but cautiously neutral signal for price momentum in August 2026. As of July 31, 2026, spot Ethereum ETFs recorded a net outflow of $6.40 million, with several major funds, including ETHA (iShares), FETH (Fidelity), and ETHW (Bitwise), closing the day in the red. Daily net inflow data shows positive flows in ETHB offset by consistent outflows in major funds.
Total Assets Under Management (AUM) stands at around $13.71 billion, indicating institutional participation remains intact. However, the recent trend of outflows, combined with declining daily volumes, suggests waning short-term enthusiasm. The most recent daily chart shows sporadic green inflow days but an overall pattern of profit-taking or rotation. For August 2026, the ETF market implies limited upward momentum unless a major catalyst emerges.
Will ETH see an uptrend in August 2026?
Yes, an uptrend is possible, supported by both historical patterns and current market dynamics. Out of 11 observed Augusts, Ethereum posted notable gains in four years, particularly during recovery or bull phases (2017: +84.88%, 2021: +27.56%, 2020: +23.92%, 2025: +18.37%).
With ETH near $1,867.23, well below its 2025 peak around $4,953, the asset sits in a historically favorable accumulation zone for seasonal rebounds. Near-term technicals lean cautiously constructive, with the 24-hour chart showing steady accumulation with higher highs and higher lows, supported by $4.54 billion in daily volume. Ethereum’s ecosystem fundamentals, including Layer-2 scaling, growing DeFi TVL, and tokenized real-world assets (RWAs), provide tailwinds.
Potential upside catalysts include positive macroeconomic shifts, such as interest-rate cuts or favorable U.S. regulatory clarity on ETH ETFs, network upgrades, or major announcements around Ethereum’s scalability roadmap; increased institutional adoption through spot ETH ETFs and corporate treasury allocations; broader altcoin season triggered by Bitcoin dominance cooling off; and strong on-chain metrics, including rising active addresses and staking participation.
If August 2026 follows patterns seen in 2020, 2021, or 2025, ETH could realistically target $2,200–$2,500, representing an 18–34% gain from current levels. Historical data shows that when ETH enters August in a depressed state relative to recent highs, it has often delivered strong mean-reversion rallies. While not guaranteed, the setup favors bulls if global risk sentiment remains constructive.
Will ETH witness a downtrend in August 2026?
A downtrend is also a distinct possibility. Six out of eleven Augusts closed in the red, with notable drawdowns in 2018 (-34.52%), 2019 (-22.72%), and 2024 (-21.83%). August has frequently acted as a corrective month, especially during periods of high valuation or macroeconomic uncertainty.
Currently, ETH is consolidating but faces meaningful overhead resistance. The 62% drawdown from its 2025 all-time high suggests lingering weakness, and the 55% drop in 24-hour volume indicates fading momentum.
Some possible catalysts that can pull the price negatively include the following: Regulatory setbacks or negative headlines regarding Ethereum’s energy consumption or staking; profit-taking by large holders (whales) who accumulated during the 2025 rally; increased competition from faster Layer-1 chains capturing market share; and seasonal weakness where traders rotate out of altcoins into safer assets ahead of September.
While an uptrend appears slightly more probable given the depressed price, the mixed historical record and subdued volume highlight real downside risk for August 2026. Investors should prepare for volatility in either direction.
ETH price outlook for August 2026: Bull, Base, and Bear Cases
Bull Case:
If Ethereum breaks decisively above the $1,950–$2,000 psychological resistance zone with strong volume, it could trigger a short squeeze and FOMO-driven rally. In this scenario, ETH would likely target $2,200–$2,450 by the end of August, representing an 18–31% gain from current levels around $1,867.
This move would be supported by strong on-chain metrics, successful Layer-2 adoption, and positive ETF inflows. A breakout above $2,000 could open the path toward retesting higher resistance levels last seen in late 2025.
Base Case:
If ETH experiences range-bound trading between $1,750 and $1,980, reflecting mixed technical signals and cautious market sentiment. This scenario aligns with historical August performance, where the asset often consolidates amid low-to-moderate volatility.
In the base case, traders can expect choppy price action with volatility around 10–15%. Price would likely oscillate within this range as the market digests macroeconomic data, ETF flows, and network developments without any major breakout catalyst. This neutral consolidation would be the most probable outcome given the current lack of strong directional momentum.
Bear Case:
If Ethereum loses the critical support zone of $1,750–$1,800, it could accelerate selling pressure. Triggered by weak ETF performance, broader market correction, regulatory concerns, or profit-taking from 2025 holders, ETH may decline toward $1,550 – $1,400 by month’s end.
This would mirror weaker Augusts such as 2018, 2019, 2022, and 2024. A breakdown below $1,750 support would signal fading bullish conviction and could lead to a deeper correction.
ETH August outlook
The August outlook leans mildly supportive, but it is far from a clean bullish call. As the historical record shows, positive catalysts can spark a breakout, while a shift in sentiment can just as easily trigger a breakdown.
For now, ETH’s August setup reads slightly bullish, but a decisive move above $2,500 remains an aggressive target that would require a stronger catalyst than the current backdrop provides.
Also Read: BNB Price Prediction Aug 2026: Breakout or Breakdown Ahead?