
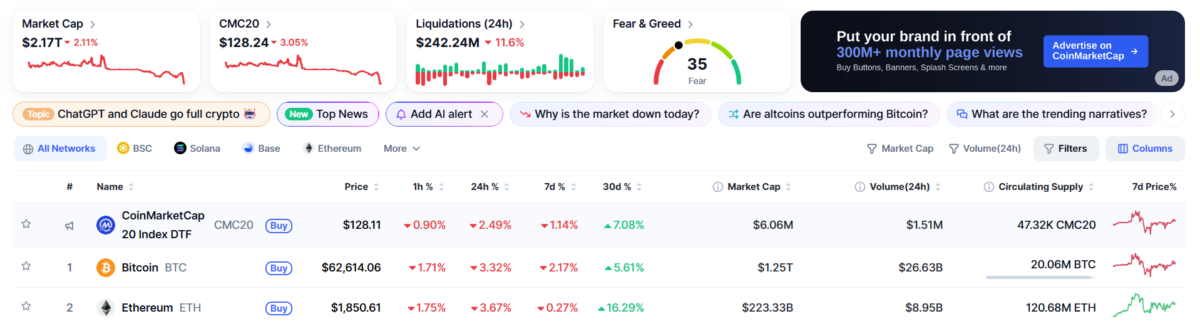
July closed with one of the most striking macro disconnects in digital-asset history. On the surface, spot cryptocurrency markets posted solid 30-day performance. Ethereum (ETH) surged 16.29% over the past month to $1,850.61, while Bitcoin (BTC) climbed 5.61% to $62,614.06, anchoring the total crypto market capitalization at $2.17 trillion.
Yet equities tied to the digital-asset ecosystem failed to mirror those benchmarks. Instead of tracking spot gains, nine of the 11 major crypto-linked stocks finished July in negative territory, producing a 70.56 percentage-point performance spread between the month’s top winner, Bitmine Immersion Technologies (BMNR), which rallied 26.56%, and its biggest casualty, American Bitcoin Corp (ABTC), which fell 44.00%.
Show
The synchronized relationship that historically bound crypto stocks to spot Bitcoin and Ethereum has broken down. In its place, the market has imposed a stricter regime that penalizes equity dilution, summer power-cost inflation, and Q2 earnings misses, regardless of how well spot crypto assets perform.
The July scorecard: Digital asset equities
The table below outlines the 30-day performance, end-of-month price levels, and sector focus for 11 major crypto-linked equities, measured against Bitcoin’s 5.61% and Ethereum’s 16.29% monthly moves.
| Ticker | Company Name | Stock Price | 1-Day Change | 30-Day Return | Sector Focus |
|---|---|---|---|---|---|
| BMNR | Bitmine Immersion Technologies | $16.76 | -7.27% | +26.56% | Ethereum Treasury & Staking Reserves |
| MSTR | Strategy Inc | $91.80 | -6.08% | +6.46% | Corporate Bitcoin Treasury Proxy |
| COIN | Coinbase Global, Inc. | $142.77 | -12.72% | -0.68% | Platform Exchange & Staking |
| CRCL | Circle Internet Group | $60.96 | -5.14% | -2.54% | Stablecoin & Treasury Reserves |
| CLSK | CleanSpark, Inc. | $13.82 | -4.95% | -3.23% | Industrial Bitcoin Mining |
| HOOD | Robinhood Markets, Inc. | $85.21 | -1.61% | -14.85% | Multi-Asset Retail Brokerage |
| MARA | MARA Holdings, Inc. | $11.38 | -3.73% | -18.14% | Large-Scale Data Center Mining |
| IREN | IREN Limited | $36.87 | -3.63% | -19.40% | AI/HPC & Compute Hosting |
| RIOT | Riot Platforms, Inc. | $21.10 | -4.61% | -23.08% | Power Infrastructure & Mining |
| WULF | TeraWulf Inc. | $17.80 | -0.14% | -27.41% | Zero-Carbon Mining & HPC Infrastructure |
| ABTC | American Bitcoin Corp | $5.62 | -4.74% | -44.00% | Treasury-Focused Mining Proxy |
Prices and returns as of approximately 7:30 PM IST on July 31, 2026 (Yahoo Finance; split-adjusted).
July’s Biggest Surprise: Crypto Up, Stocks Down
While spot assets registered steady monthly gains overall, market dynamics shifted sharply during the final 24 hours of July. Total market capitalization dipped 2.11% to $2.17 trillion, driven by single-day pullbacks in BTC (3.32%) and ETH (3.67%).

This late-month friction triggered $242.24 million in 24-hour liquidations across derivatives exchanges, dragging the Fear & Greed Index down to 35 (“Fear”).
The tension amplified equity volatility. Because digital-asset stocks had already been struggling with compressed hashprices and elevated summer operating costs, the sudden end-of-month spot pullback acted as a catalyst for heavy profit-taking across equity trading desks.
Bitcoin Rose, But Mining Stocks Still Struggled
Historically, a 5.61% monthly increase in spot Bitcoin was more than enough to drive high-beta mining stocks higher. In July, that relationship broke down for every public Bitcoin miner in this cohort, CLSK, WULF, MARA, IREN, and RIOT all finished the month lower than spot BTC, and all but CLSK finished in double-digit negative territory.
The underlying issue remains the post-halving hashprice squeeze. With global network hashrate elevated and reward payouts fixed, operating margins stayed thin. Miners with high power costs or heavy capital-expenditure programs absorbed operational drag that a modest Bitcoin rally couldn’t offset.
CleanSpark (CLSK) Limited the Damage
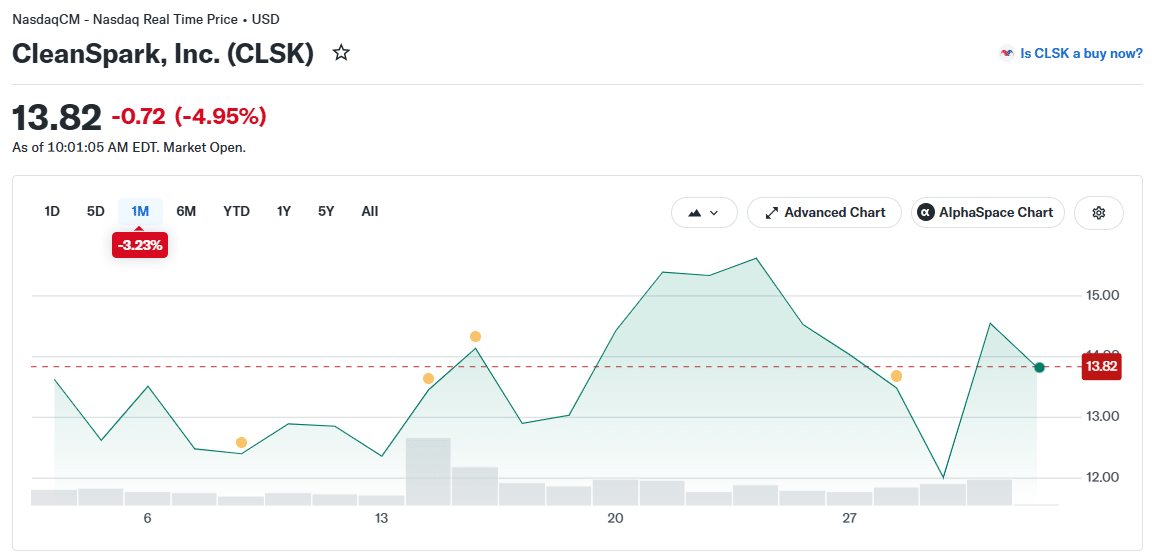
CleanSpark proved the most resilient of the group, declining just 3.23% to close at $13.82. It traded roughly between $12.00 and $15.50, executing a mid-month rally before pulling back with the broader market on July 31.
CleanSpark’s balance-sheet structure protected it from deeper drawdowns. By owning its data-center infrastructure rather than relying on high-cost hosting leases, CLSK maintained strong fleet efficiency. It couldn’t fully match spot Bitcoin’s gain, but its modest drop was far less severe than the double-digit slides of its scale competitors.
TeraWulf’s AI Expansion Came at a Cost
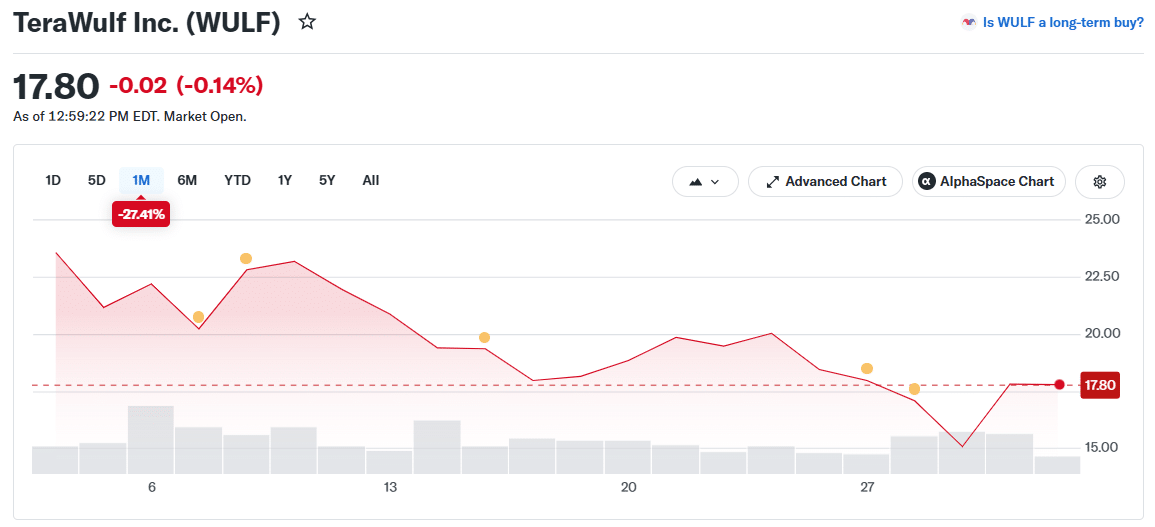
TeraWulf dropped 27.41% across July, sliding from early-month highs near $24.00 to close at $17.80, despite a minor 0.14% intraday drop on the final session.
WULF’s drawdown reflects the market weighing near-term capex against long-term advantage. TeraWulf boasts one of the lowest power-cost profiles in the sector, drawing on zero-carbon nuclear and hydro sources at its Lake Mariner and Cayuga facilities.
But its aggressive expansion into high-performance computing (HPC) and AI hosting required heavy capital deployment through Q2 and Q3. Institutional desks treated WULF much like IREN (-19.40%), discounting near-term equity value while buildout costs weighed on free cash flow before HPC revenues fully materialize.
MARA Holdings, IREN, and Riot Platforms: Operating Costs Drag Valuations
The industry’s other large miners suffered sustained selling. MARA Holdings dropped 18.14% to $11.38, IREN Limited lost 19.40% to $36.87, and Riot Platforms fell 23.08% to $21.10.
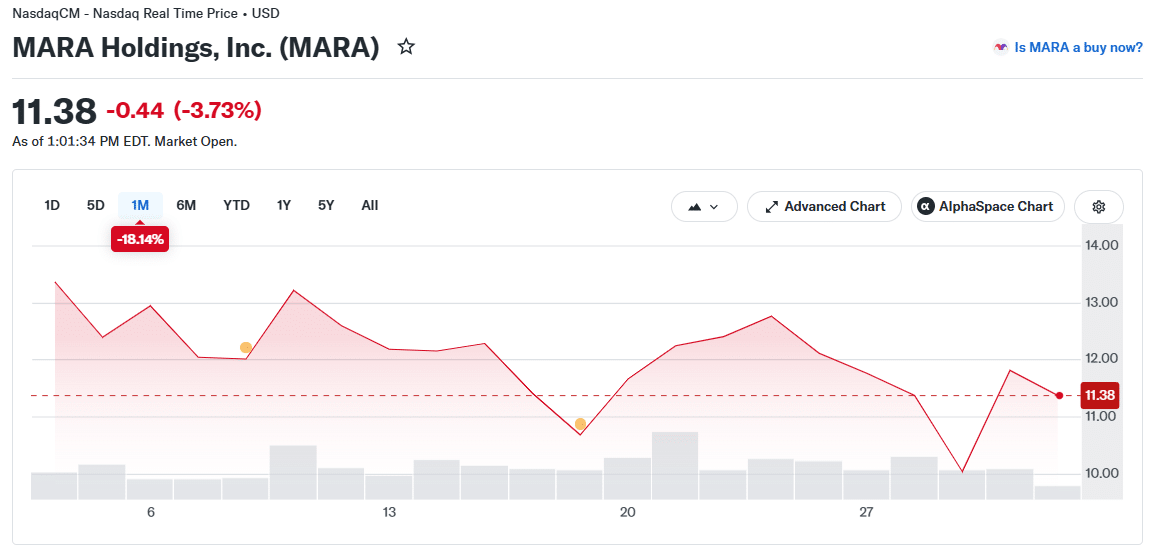
For MARA, its full “HODL” strategy, retaining 100% of mined Bitcoin rather than selling to fund operations, forces it to tap debt and equity facilities to cover cash burn. With hashprice margins compressed, the market discounted MARA’s valuation to reflect that balance-sheet risk.

IREN suffered from a timing mismatch between its legacy mining business and its high-profile transition into HPC and AI hosting. Long-dated AI data center contracts offer high future margins, but current GPU procurement required heavy near-term capex that depressed short-term cash flow. IREN’s own $2.8 billion AI-cloud contract haul, announced July 20, sparked a sharp rebound off mid-month lows but did not fully repair the monthly loss.

Riot faced shifting power-grid economics. Reduced net curtailment credits from ERCOT during July heatwaves meant RIOT absorbed higher net energy costs than institutional models had assumed, breaking technical support near $22.50 to close at $21.10.
The Treasury Accretion Spectrum: MSTR, BMNR, and ABTC
July delivered a clear verdict on how public companies should structure digital-asset treasuries. Strategy Inc (MSTR), Bitmine Immersion Technologies (BMNR), and American Bitcoin Corp (ABTC) all hold crypto on their balance sheets as their core model, yet their trajectories diverged sharply based on how each is financed.
Strategy Inc (MSTR): Accretion via Premium Issuance and Convertible Debt
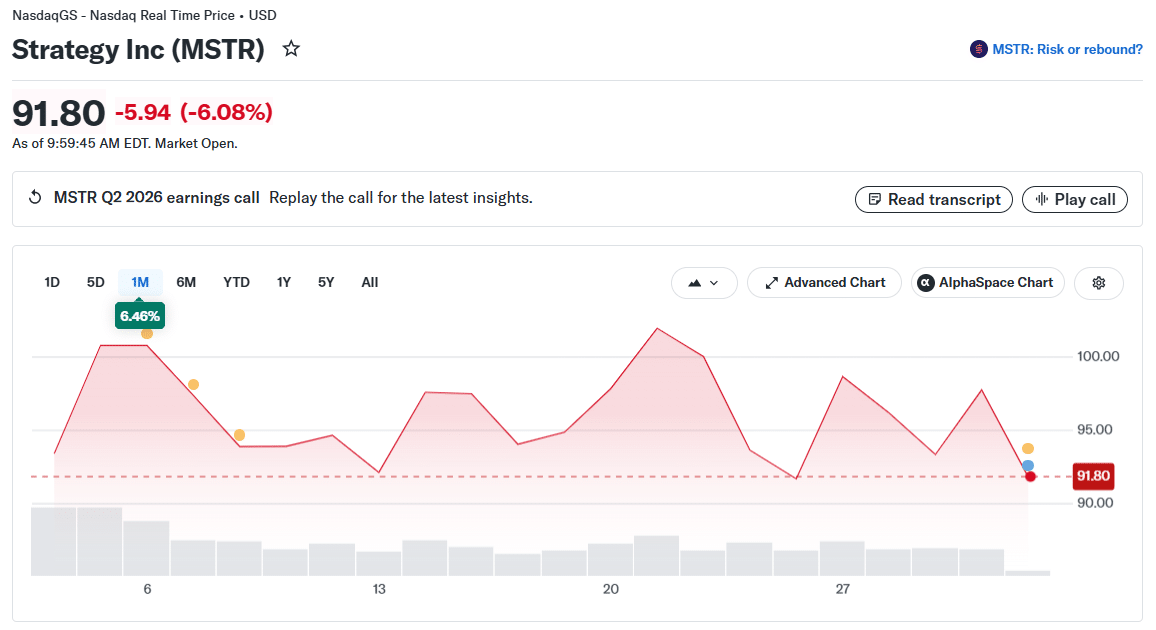
Strategy finished July up 6.46% at $91.80, outperforming spot Bitcoin (5.61%). Shares traded roughly between $90.00 and $102.00.
MSTR’s relative strength rests on capital-structure design. It funds Bitcoin purchases through a mix of low-coupon convertible debt and at-the-market equity issued at a premium to the value of its Bitcoin holdings, a structure it argues grows Bitcoin-per-share rather than diluting it, and one equity investors have historically paid a premium to own.
That framing has to be read alongside Strategy’s Q2 2026 results, released July 30. The company reported a net loss of roughly $8.22 billion, about $24.45 per diluted share, versus consensus expectations near a $2.19 loss, driven almost entirely by an $8.32 billion unrealized markdown on its Bitcoin under fair-value accounting.
As of late July, it held about 843,775 Bitcoin at an average cost near $75,476, leaving the position roughly 14% underwater against a market price around $64,900 and worth about $54.8 billion versus a $63.7 billion acquisition cost.
Crucially, the “never sell” era has ended: Strategy has begun selling small amounts of Bitcoin under a new monetization program to help cover preferred-stock dividends, built a multi-billion-dollar USD reserve for that purpose, and paused fresh Bitcoin purchases until month-end. None of this breaks the accretion argument, the per-share story holds, but it is a reminder that MSTR’s reported earnings and its stock remain highly exposed to short-term Bitcoin swings, and shares came under renewed pressure on July 31 itself (-6.08%).
Bitmine Immersion Technologies (BMNR): The Ethereum-Treasury Exception
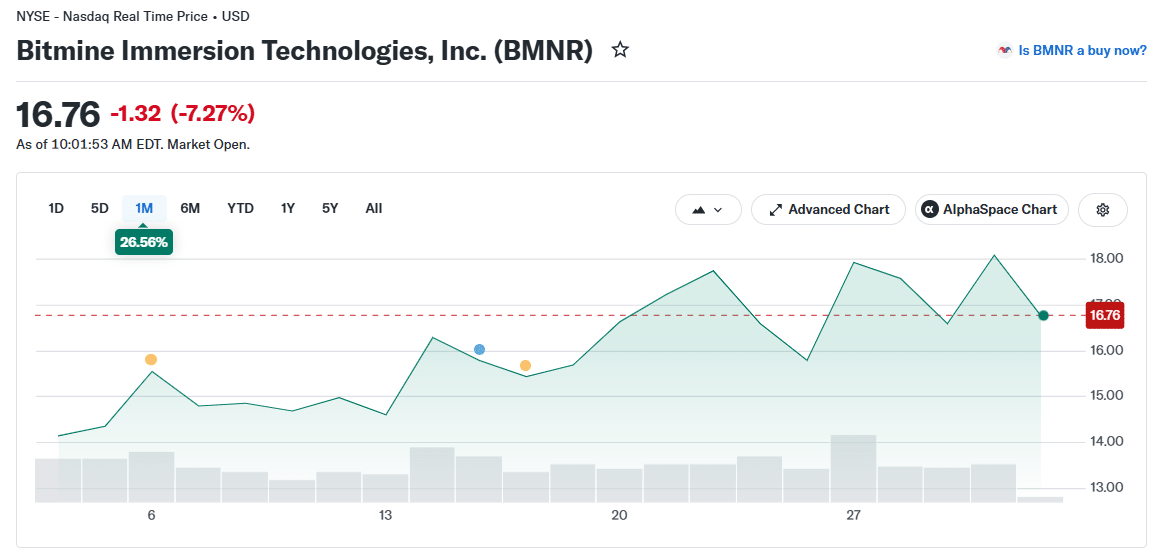
Bitmine surged 26.56% across July, climbing from sub-$14 levels to peak above $18.00 before settling at $16.76, the best return in the cohort, and well ahead of Ethereum’s own 16.29% monthly gain.
BMNR began life as a Bitcoin miner but has repositioned entirely around Ethereum. As of late July, it held roughly 5.79 million ETH, about $11 billion at current prices, within total holdings near $11.8 billion, including cash and other stakes, making it the largest public Ethereum treasury in the world and the second-largest crypto treasury of any kind, behind only Strategy’s Bitcoin. Its explicit strategy, in the words of chairman Tom Lee, is to maximize ETH-per-share: the MSTR playbook, applied to Ethereum.
Three factors explain why BMNR outran ETH’s own rally rather than simply matching it:
Leveraged Balance-Sheet Exposure: With the bulk of its enterprise value tied to its ETH holdings, BMNR functions as a levered proxy for Ethereum, amplifying spot moves in both directions.
Staking Yield on Top of Price Appreciation: Roughly 85% of BMNR’s ETH, about 4.9 million tokens, is staked through its own MAVAN validator platform, generating an annualized yield in the low-single digits. That recurring income layers cash-flow-based upside on top of pure price appreciation, something spot ETH holders don’t get.
Scarcity Premium: BMNR’s stated goal of accumulating 5% of the total ETH supply has made it a magnet for investors seeking concentrated, large-scale Ethereum exposure through a single, liquid equity.
American Bitcoin Corp (ABTC): A Reverse Split Signals Distress

American Bitcoin was the worst-performing crypto equity in July, falling 44.00% to close at $5.62, and the mechanism matters. The defining event of its month was a 1-for-15 reverse stock split, effective July 2 and trading on a split-adjusted basis from July 6, executed to keep the stock above Nasdaq’s $1.00 minimum-bid requirement.
Reverse splits of that ratio are defensive maneuvers, not signs of strength, and even on a split-adjusted basis the shares fell 44% over the month, leaving them down roughly 95% from their post-listing peak.
ABTC, co-founded by Eric Trump and majority-controlled by Hut 8, runs a Bitcoin-accumulation model that has leaned heavily on share issuance to build its treasury. When a treasury proxy’s equity trades below the value of the crypto backing it, that issuance is dilutive to net asset value per share, the mirror image of the premium-funded accretion that rewarded MSTR and BMNR.
With the stock deeply discounted and a reverse split required to maintain its listing, ABTC became July’s cautionary tale.
Exchange Stocks Faced Their Own Challenges
Even Ethereum’s 16.29% surge and Bitcoin’s 5.61% gain couldn’t fully shield exchange and brokerage platforms from broader equity headwinds.
Coinbase Global (COIN): The Q2 Earnings Cliff
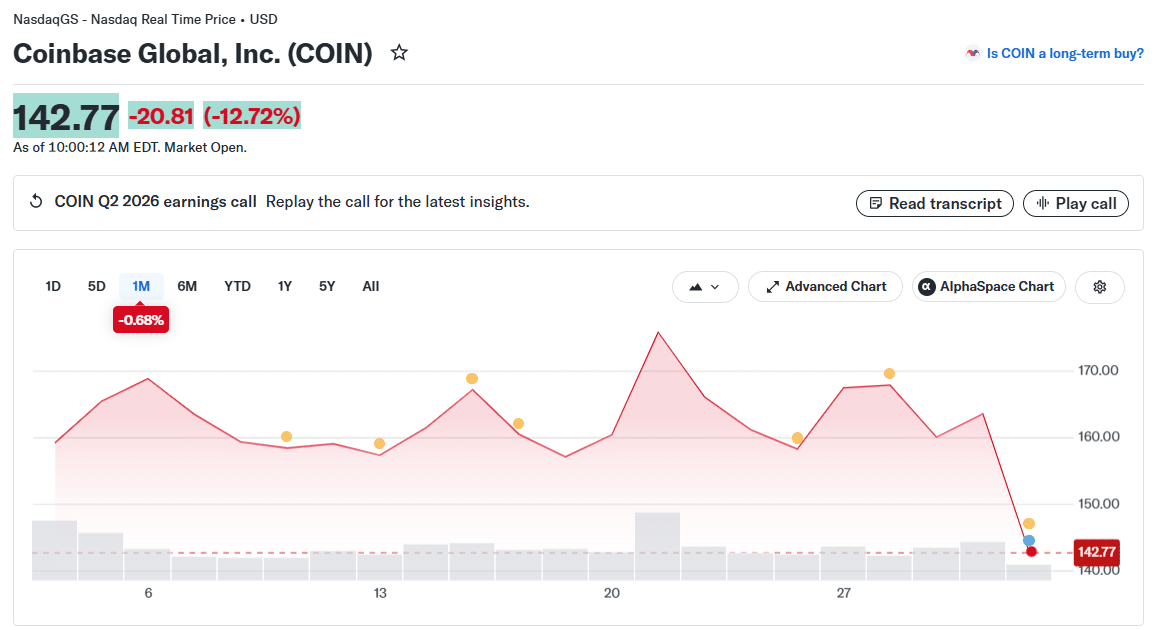
Coinbase looked set to log a positive month, trading comfortably between roughly $155 and $172 for nearly all of July. But its Q2 report, released after the close on July 30, changed the trajectory overnight.
COIN shares fell 12.72% on July 31, dropping from $163.58 to $142.77 in a single session and erasing the monthly gain to finish slightly lower, at 0.68%. The trigger was a top-line miss: revenue came in at about $1.22 billion versus roughly $1.29 billion expected, with transaction revenue of about $599 million against expectations near $628 million, as the quarter’s softer crypto prices weighed on trading activity.
Investors focused on whether subscription and services revenue could offset weaker transaction fees. Despite the earnings-day shock, COIN still finished the month close to flat, outperforming the pure-play miners and retail brokerages.
Circle Internet Group (CRCL): Stable Reserve Yields Limit Volatility
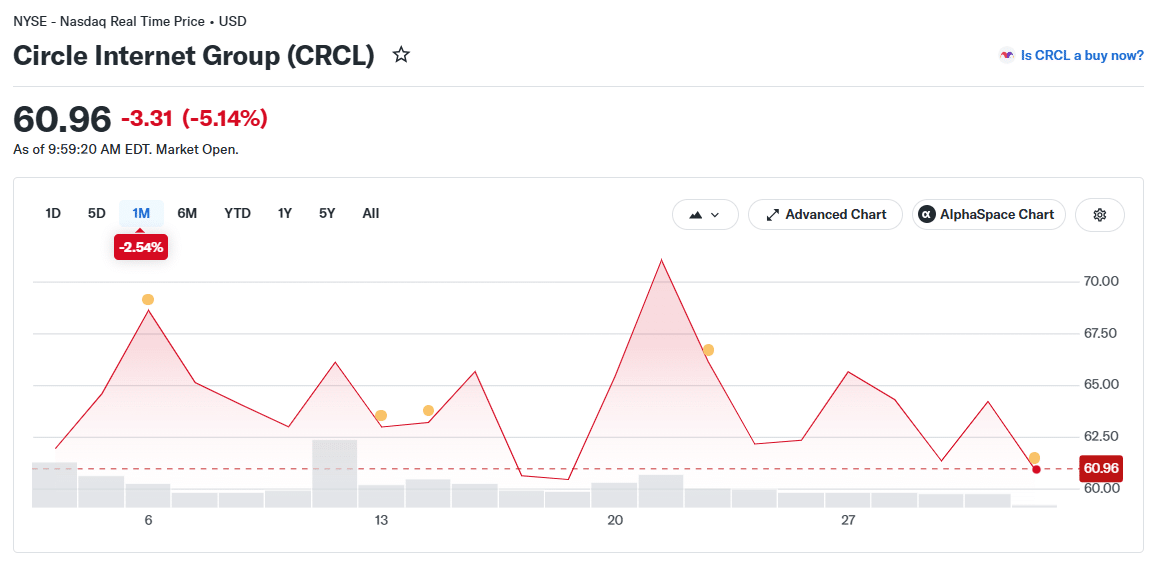
Circle traded with predictable stability, finishing July down 2.54% at $60.96. It rallied past $71.00 mid-month on expanding USDC volume before pulling back. CRCL’s model rests on interest income from the U.S. Treasury reserves backing USDC; with policy rates still elevated, that cash flow cushioned it from the double-digit sell-offs seen across higher-beta names.
Robinhood Markets (HOOD): Retail Trading Slowdown
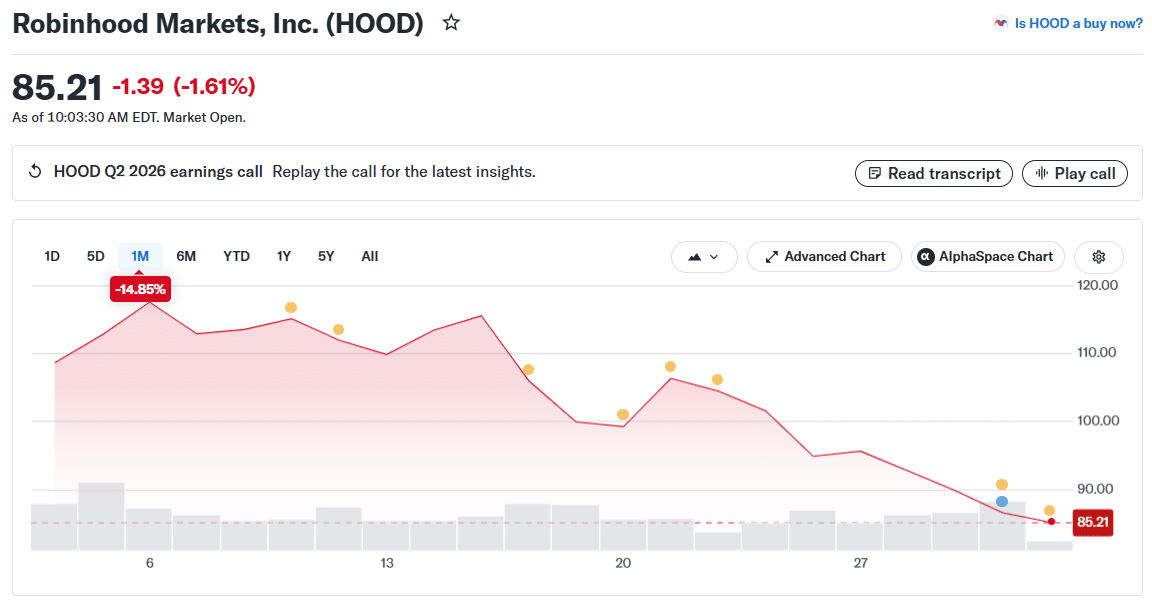
Robinhood trended lower throughout July, falling 14.85% to close at $85.21. Its performance reflected a mid-summer cooling in retail options and crypto-trading velocity. With sentiment sliding into “Fear” (35/100) by late July, retail transaction volumes slowed, and analysts trimmed near-term revenue targets, pulling HOOD off its early-summer highs.
Key Takeaways for H2 2026 Strategy
The July divergence highlights an evolving crypto-equity landscape. Investors can no longer rely on simple spot momentum to lift valuations across the board. Three structural rules are guiding stock selection into the second half:
How accretion is financed matters more than which token is held
MSTR (+6.46%) and BMNR (+26.56%) show that markets reward treasury strategies funded through debt, staking yield, or equity issued at a premium to net asset value, mechanisms that grow crypto-per-share. ABTC (-44.00%) shows the opposite: a treasury proxy trading at a discount, forced into a reverse split to hold its listing, destroys NAV per share regardless of how the underlying asset performs. The asset (BTC vs. ETH) mattered less in July than the financing structure behind it.
Infrastructure capex vs. immediate cash flow
In mining, transitioning into HPC/AI or maintaining massive power capacity (WULF, RIOT, IREN) requires heavy near-term capex. The long-term assets are attractive, but near-term cash burn drove double-digit declines, and even the most disciplined operator (CLSK) still lagged spot Bitcoin.
Public equity multiples are normalizing
Coinbase’s 12.72% post-earnings drop shows that major crypto platforms are now judged under standard software and fintech frameworks, held to operating discipline, margins, and quarterly revenue targets like any other public company.
What July means for crypto stocks
July 2026 marked a clear transition for the crypto-stock universe. While spot assets like Ethereum (+16.29%) and Bitcoin (+5.61%) demonstrated solid underlying demand, public equities faced a rigorous repricing, one where the two standout winners, MSTR and BMNR, earned their gains by converting spot strength into per-share value through capital-structure efficiency and staking yield, respectively, rather than through simple asset-price correlation.
Going forward, stock selection within the digital-asset sector requires granular fundamental analysis. Investors who prioritize non-dilutive balance-sheet management, disciplined capital allocation, and financing structure, not just which coin a company holds, are far better positioned to navigate this maturing equity market.
Also Read: Bitcoin Miner Stocks Rally as WULF, MARA, IREN Lead Gains