
Key Highlights
- CASHCAT has dropped 11% in 24 hours and over 20% in seven days.
- Trading volume jumped 147.3% to $26.48 million as selling increased.
- CASHCAT is testing support while RSI nears oversold levels, giving buyers a chance to push for a rebound.
Cash Cat (CASHCAT) memecoin has dropped 11% over the last 24 hours, adding to over 20% drop over the past seven days as traders watch to see whether the sell-off will continue or the token can find a way back up.
According to data from CoinMarketCap, the token is trading for $0.1008 after a sharp fall from its August high, putting traders in a careful position as they assess the next move.
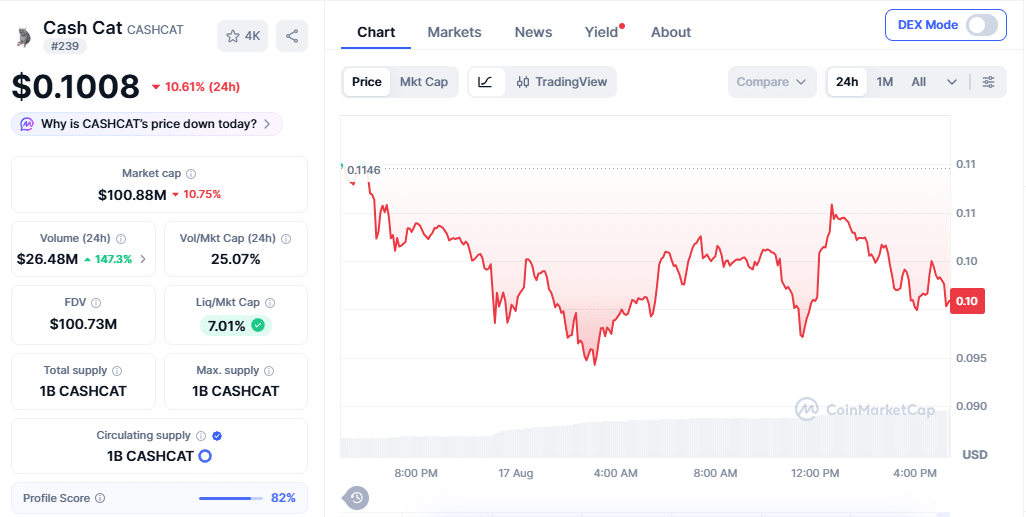
Still, CASHCAT is still up more than 70% over the past month, which means this recent drop is small compared with the size of its earlier gains. This has raised the question of whether the token is entering a longer downtrend or simply taking a break after its rapid rise.
Meanwhile, the trading activity has also increased during the fall. Data from CoinMarketCap shows that trading volume is now up by 147.3% today to around $26.48 million in volume. But compared to the fall, this surge supports these are just traders selling their position.
Trading volume jumps despite sell off
At the same time, futures market data also shows that sellers have been active. According to data from Coinglass, CASHCAT’s Long/Short Ratio has fallen to 0.823. A reading below 1 means there are more short positions than long positions in the market.
In addition, open Interest is also down more around 13.74% to $21.14 million, showing that some positions have been closed as the price moved lower.
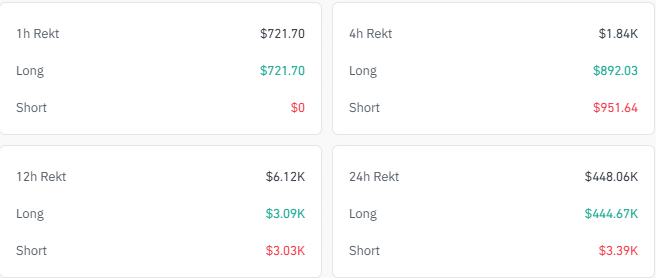
The pressure can also be seen in liquidation. Coinglass data shows that around $448,000 in long positions were wiped out over the past 24 hours. Around $444.67k from that total came from traders who had bet on the price going up, while the rest, around $3.39k came from sellers.
CASHCAT test key support level
Still, the picture is not completely one-sided. CASHCAT’s 4-hour Bollinger Band shows the price moving into the lower band during the decline. The token has since started moving higher.
The chart shows that price is sitting at a higher time frame support level at $0.089. This level is also below the 20, 50, 100, and 200-period EMA. Based on the chart pattern, If price could reject from this level, it could see another push back up to $0.16 which is where the higher time frame resistance level is.

Moreover, the Relative Strength Index (RSI) is at 38.99, which shows that sellers are still active in the market. However, reaching an oversold level could give buyers a chance to take over the market.
Also Read: Hyperliquid’s HYPE Token Climbs Toward Key Resistance as Bulls Eye $77 Breakout