


XRP, the native token of the XRP Ledger (XRPL), fell back below $1 on Saturday, November 14, 2026, a day after it first broke under the level since August. The drop came as Bitcoin slid toward $67,000, leveraged traders across the crypto market were forced out of their positions, and investors pulled money out of U.S. XRP funds.
Show
XRP Price Today: XRP Trades at $0.9932
XRP traded at $0.9932 at 3:54 AM UTC on November 14, down 1.7% over 24 hours, according to CoinGecko. The token had reached a 24-hour high of $1.06 before sellers pushed it back below $1.
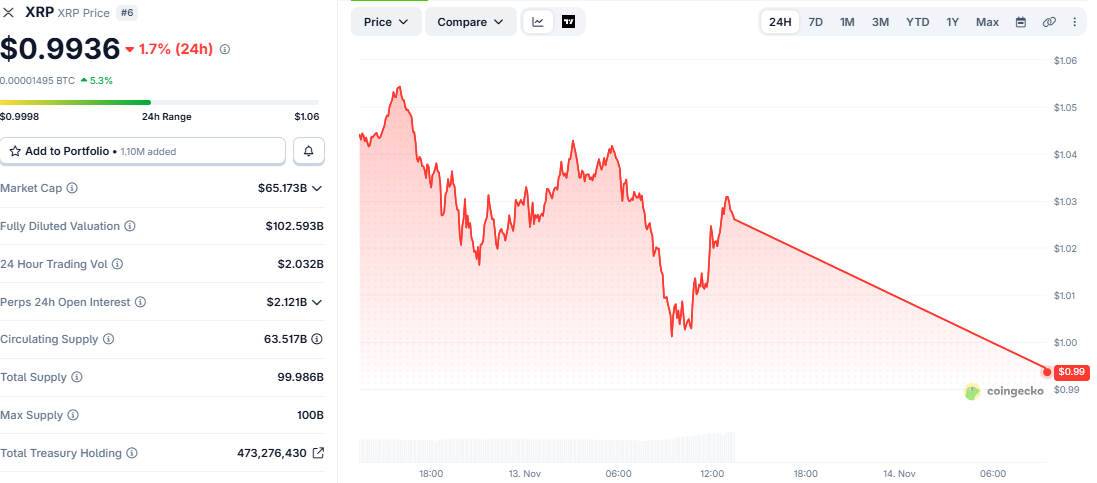
XRP’s market capitalization, the total value of all tokens in circulation, stood at $65.17 billion, while 24-hour trading volume reached $2.03 billion. Circulating supply is 63.52 billion XRP out of a maximum supply of 100 billion. Open interest in XRP perpetual futures was $2.12 billion. Open interest is the total value of open futures contracts, and perpetual futures have no expiry date.
XRP is down about 14.5% over the past week and roughly 38% from its October high near $1.60. The token is also about 72.8% below its all-time high of $3.65, set in July 2025.
The latest drop extends a steady November sell-off. XRP fell 5% to $1.23 on November 5, then dropped 9.4% to $1.18 on November 6. A brief rebound to $1.07 on November 11 faded within two sessions.
XRP Breaks Below $1 for the First Time Since August
On Friday, November 13, XRP dipped below $1 for the first time since August, touching an intraday low near $0.9967 before buyers lifted it back to the $1.02 to $1.04 range. The token did not record a daily close below $1 that day.
Saturday’s move to $0.9932 marked a lower low, leaving XRP close to its 2026 low of about $0.986, set on August 14. In August, XRP closed below $1 on two days before recovering.
XRP held up slightly better than Bitcoin (BTC). Bitcoin was down 3.66% over 24 hours at $68,197 at 1:15 AM UTC on November 14, according to CoinGlass, and later slid to about $67,380.
XRP Liquidations: Long Traders Lose $15.05 Million
A liquidation happens when an exchange forcibly closes a leveraged position because the trader’s collateral can no longer cover losses. Leverage means trading with borrowed funds. A long position profits when prices rise, while a short position profits when prices fall.
CoinGlass liquidation data shows $16.94 million in XRP positions were liquidated over 24 hours as of 3:54 AM UTC on November 14. Long positions accounted for $15.05 million, or 88.8%, while short positions made up $1.89 million, or 11.2%.
Across the crypto market, liquidations totalled $928.89 million over the same period, affecting 146,919 traders. Long positions accounted for $772.32 million, or 83.1% of the total. Bitcoin led with $452.32 million in liquidations, followed by Ethereum (ETH) at $199.13 million and Solana (SOL) at $47.38 million. The largest single liquidation was a $17.81 million ETH/USDT short position on Binance.
Selling picked up in recent hours, with $321.85 million liquidated in the past four hours and $73.29 million in the past hour. Earlier 24-hour readings on November 13 and 14 had topped $1.26 billion, but those figures have dropped as Friday’s peak liquidations moved outside the 24-hour window.
Why Is XRP Price Falling?
The decline appears to be driven by market-wide pressure rather than XRP-specific news.
Bitcoin’s slide: Bitcoin’s drop below $70,000 and then $68,000 triggered forced selling across crypto derivatives markets, pulling XRP and other altcoins lower.
Nvidia CEO resignation: On November 12, Nvidia said Jensen Huang had resigned as president, chief executive officer (CEO) and board member, effective immediately, and named Chief Financial Officer (CFO) Colette Kress as interim CEO. The news hit technology stocks and spilled into crypto markets, where tokenized Nvidia shares and Nvidia-linked perpetual futures trade around the clock.
Hotter U.S. inflation: The October Consumer Price Index (CPI), which tracks changes in everyday consumer prices, rose 0.4% month-over-month against a 0.3% forecast. Core CPI, which excludes food and energy, rose 0.3% against a 0.2% forecast. Traders are now pricing in a quarter-point interest rate hike at the Federal Reserve’s December 8 to 9 meeting, according to the CME FedWatch Tool. Higher interest rates tend to reduce demand for riskier assets such as crypto.
Weak ETF demand: Outflows from U.S. spot XRP ETFs have removed a source of steady buying.
XRP ETF Outflows Reach $19.13 Million
A spot XRP ETF holds actual XRP tokens, letting investors gain exposure through a regular brokerage account. The first U.S. spot XRP ETF, Canary Capital’s XRPC, began trading on Nasdaq on November 13, 2025, almost exactly one year ago.
According to SoSoValue data, U.S. spot XRP ETFs recorded net outflows of $10.42 million on November 9 and $7.62 million on November 10. Flows were flat on November 11 and 12, before another $1.09 million left the funds on November 13. That day, Franklin Templeton’s XRPZ drew $4.45 million in inflows, while Grayscale’s GXRP lost $5.54 million.
Total net assets across U.S. spot XRP ETFs stood at about $1.14 billion as of November 13, with cumulative net inflows close to $1.80 billion since launch.
Large XRP Holders Continue to Accumulate
On-chain data shows larger holders have kept buying through the decline. According to Santiment data, the number of wallets holding at least 10,000 XRP rose to 343,578 on November 12, a one-year high.
The same group grew in August, when XRP last traded below $1, and the token then rallied about 72% over the following eight days. Past price action does not guarantee a similar move.
XRP Price Analysis: Analyst Says $0.99 Must Hold
Crypto analyst Ali Martinez said in a post on X on November 13 that XRP failed to break above the $1.55 resistance at the top of its trading channel and has completed a full reversal toward the channel’s lower boundary at $0.99.
“Now, $0.99 must hold,” Martinez wrote, adding that a loss of this support could extend the correction toward $0.80.
A trading channel is a range between two parallel trendlines on a chart. Support is a price level where buying has previously stopped declines, while resistance is a level where selling has previously capped gains. A sustained break below $0.99, confirmed by daily closes, would point to a possible 19% further decline to $0.80.
Other analysts remain divided. Trader CrediBULL Crypto expects XRP could fall below $0.98 into a $0.60 to $0.90 accumulation zone before its next major rally. Analyst Crypto Patel said he would add to his position between $0.70 and $1.00, but warned that a confirmed break below $1 could lead to a 30% to 40% drop. On the bullish side, analyst EGRAG CRYPTO called $0.98 the “line in the sand” for his bullish outlook.
Momentum indicators remain weak. XRP’s daily Relative Strength Index (RSI), which measures the speed of price moves on a scale of 0 to 100, fell to 21.52 on November 13. A reading below 30 signals oversold conditions, which can come before a relief bounce but does not confirm a bottom. The Moving Average Convergence Divergence (MACD), a trend-momentum indicator, remains bearish. XRP is also trading below its 20-day moving average of $1.21, its 200-day average of $1.26, and its 50-day average of $1.34.
XRP Price Levels to Watch
On the downside, the first support sits near $0.986, the August 14 low. Below that, analysts see support between $0.90 and $0.95, followed by $0.80 to $0.85.
On the upside, XRP faces resistance between $1.00 and $1.04, then at $1.10. The $1.18 to $1.25 zone, which acted as support earlier in November, has now turned into resistance and sits near the 20-day moving average.
A daily close above $1.04 would ease immediate selling pressure, while a move back above $1.21 with renewed ETF inflows would signal a stronger recovery. A daily close below $0.986 would break the August low and expose XRP to the $0.90 region.
What’s Next for XRP?
XRP’s near-term direction is likely to depend on whether Bitcoin can stabilize above $67,000, whether XRP can close the weekend above $1, and whether ETF flows turn positive when U.S. markets reopen on Monday. Traders will also track Nvidia’s upcoming quarterly results and the Fed’s December 8 to 9 rate decision.
Also Read: HYPE Token Jumps as Hyperliquid Reports $190.9M in Q3 Revenue