


Show
Bitcoin is reportedly facing more pressure as Tether’s USDT market capitalization drops by $6.6 billion in 60 days, according to CryptoQuant.
In a report released on November 10, the firm said the decline was larger than the drop recorded after the FTX collapse in December 2022.
The fall in USDT supply comes as Bitcoin struggles to attract buyers and hold its price. CryptoQuant reported that Bitcoin’s apparent demand fell by 284,000 BTC over the past 30 days, marking its sharpest decline since March 2025.
At the same time, the Coinbase Premium Index remained negative for 30 straight days, showing that demand from US-based spot buyers has remained weak.
USDT liquidity continues to shrink
USDT is one of the most widely used stablecoins in the cryptocurrency market. Traders often hold it when they want to protect their money from price swings or use it to buy Bitcoin and other cryptocurrencies.
This makes its supply an important measure of how much money could be available to enter the market. When USDT supply grows, it can provide more money for traders looking to buy digital assets. However, when its market capitalization falls, it may mean that some money is leaving the crypto market, reducing the buying power available to support prices.
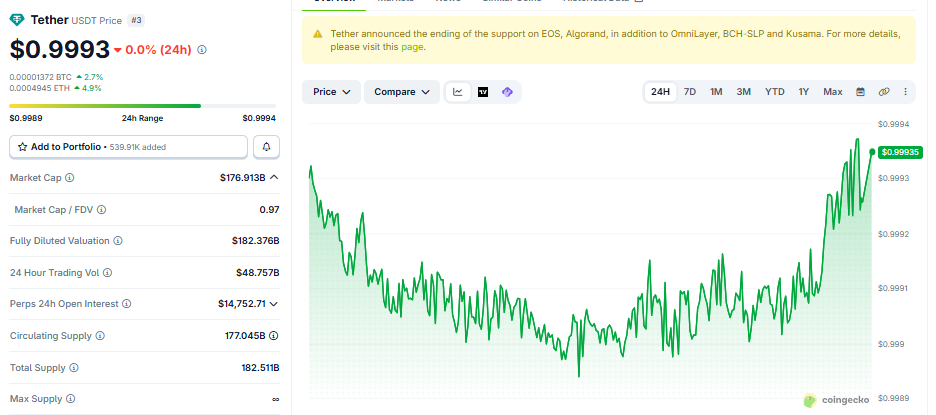
CryptoQuant said USDT’s market capitalization has dropped by $6.6 billion over the past 60 days. The decline is more than twice the contraction recorded during the December 2022 redemption wave following FTX’s collapse.
According to Coingecko as of 17:43 UTC on November 10, the market cap is currently holding at $176.913 million in value as of the time of reporting.
The research also showed that Bitcoin has fallen 9% over the past 30 days and is down 15% from its September peak of $87,400. CryptoQuant linked the decline to profit-taking after September’s rally, a more hawkish Federal Reserve, the Binance hack and the Republicans’ defeat in the US midterm elections.
Bitcoin indicators turn bearish
The pressure is also showing in CryptoQuant’s Bull Score Index, which measures different market conditions to assess Bitcoin’s strength. The index has fallen from 90 on October 13 to 20 on November 10, placing it in the extra bearish category.
However, this reading does not automatically mean that Bitcoin will continue falling. CryptoQuant recalled that the index also dropped to 20 in April 2025 after a market sell-off linked to US tariffs. It later recovered to 80 within two months as Bitcoin found a local bottom.
The report also found that investors who bought Bitcoin one to three months ago are now sitting on losses. Their average unrealized profit margin dropped from 33% on September 22 to negative 6%. CryptoQuant said similar margins have reached around negative 12% during previous bull-market corrections.
Bitcoin has also fallen below its 365-day moving average of $76,400. Its 200-day moving average at $73,200 is the next important support level. According to CryptoQuant, a break below this level could expose Bitcoin to a deeper correction.
Analysts disagree on Bitcoin’s next move
However, market analysts have different views about whether Bitcoin has reached its bottom. In a post on X, Crypto analyst Lennaert Snyder said Bitcoin moved lower after US inflation data came in slightly hotter than expected. He noted that the price swept the $73,500 previous weekly low, taking more sell-side liquidity from the market.
Snyder believes Bitcoin needs time to settle after the decline. He is not rushing into long positions and wants to see a clear change in price direction before buying. He identified $78,000 and $80,000 as areas where he may look for short positions.
He also explained that a strong break below $73,500, followed by a move back to that level as resistance, could create another opportunity to sell. However, if Bitcoin fails to break lower and instead recovers above the level, he sees $76,200 as an interesting upside target.
Another analyst with the username Freedom By 40 has a more positive view. The analyst said bullish divergences are beginning to appear across several timeframes. A bullish divergence occurs when price continues falling while indicators begin showing signs that selling pressure may be weakening.
He believes Bitcoin could find support around the $71,000 region, which represents the 0.5 Fibonacci retracement level. He also warned that more long positions could be liquidated before the market turns upward.
Mister Crypto also expects a recovery. He pointed to a falling wedge breakout on Bitcoin’s two-week chart, comparing it with a similar breakout in 2023. He said he expects the current pullback to form a higher low before Bitcoin begins another upward move.
Despite these different views, CryptoQuant’s main concern remains the shrinking supply of stablecoins and the lack of strong buying demand. The research says the current market conditions could mark a local bottom, as seen in previous corrections, or signal the beginning of a deeper decline.
Also Read: Bitcoin Crashes Below $74K as U.S. Inflation Beats Expectations